

The crafting of a government budget is always fictional because it comes from the minds of politicians who are universally optimistic about the future. All that needs doing is to determine if the exaggerations will be tolerable or drive us all into a deepening fiscal hole for no good purpose.
[quote]BC’s resource revenues have tumbled from $4.527 billion in 2006 to $2.473 in 2013.[/quote]
Exaggerating GDP
The first question we should ask is whether the BC Liberal government’s record of estimating the Gross Domestic Product (GDP) has been reasonably accurate. Unfortunately, this has not been the case. It has consistently expected greater growth than realized for at least 8 years running and is keeping with that narrative this year. Real GDP growth has been about 1.4% or less. Following the established pattern of exaggeration, this year and next year the government is looking for 2 and 2.3%, respectively. Switching to “Nominal GDP Growth”, the increases are 3.6 and 4.3%.
So where is the risk in this bullish outlook? It is, as always, in a false sense of future financial well being that it creates. If one wants to borrow and spend without inhibition, it becomes easier to do so when one self-deludes that there are better times ahead.
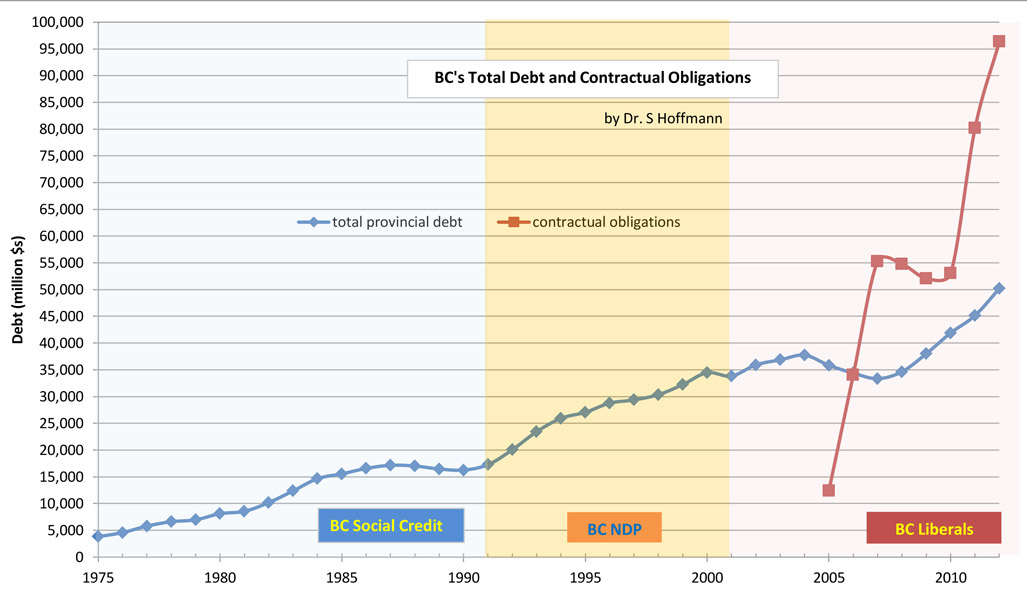
$125 Billion in new liabilities since 2006
This model of borrowing and spending has prevailed in BC since about 2006 and most of the fiscal consequences are only now showing up. Since 2006, the reported total liabilities of the province increased from $52 billion to over $75 billion a year ago.
In addition, there are liabilities that are indirectly backed by the provincial government and reported as “contingencies and contractual obligations”. They grew from close to zero in 2006 to $100 billion a year ago. These new liabilities must also be paid by us all and they are the principle reasons that budgets for health care and education have been so rubbished.
Just one example: BC Hydro has about $50 billion in contractual obligations that are not included on its balance sheet as liabilities. Because the corporation has not been collecting sufficient cash to meet its obligations since 2006, it has parked $5 billion – and growing – in accounts receivable that will only begin to be paid off when electricity rates are increased by at least 35%.
This is only one example of money to be recovered from the disposable incomes of BC residents and businesses. It alone is the equivalent of removing $1.5 billion a year from our annual incomes.
You can’t fool the Baltic Dry Cargo Index
Much has been made of the recent national increase in quarterly GDP but caution should be the watch-word. Half of the increase comes from a build up of yet-to-be-sold inventory and the other half from consumer spending made possible by increasing debt.
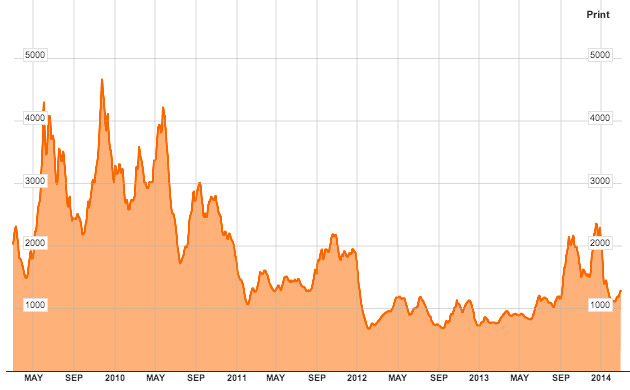
So what should the government be using as an independent indicator of GDP growth? The only index that is held to be free of derivative “gaming” is the “Baltic Dry Cargo Index”. Defined as “an assessment of the price of moving the major raw materials by sea”, it is the clearest, most honest indicator of global economic activity. Here is a link to Bloomberg’s interactive chart.
The Index fell off a cliff from its peak of over 11,000 in 2008 – and while it had recovered somewhat by 2009, it has been most downhill again since. The evidence is clear that the global economy has been in a contraction since 2008.
Currently there are hundreds of freighters standing idle and we see some of them here on the west coast. You would think that those in government would look out their windows and see all this idle shipping and then have the penny drop that an economy that is mostly dependent on exporting primary commodities is going nowhere in a hurry until the world has finished correcting for credit excesses. This reality is not evident in this year’s budget.
Seeing resource revenues through rose-coloured glasses
Drilling further into the budget, it is instructive to look at the government’s outlook for “Natural Resource Revenues” (royalties, etc.). In 2006 it reported these revenues were at an all-time high of $4.527 billion. From that point on revenues decreased every year but one, arriving at $2.473 billion in 2013.
If this were a common share of a corporation, would you be an enthusiastic investor when the global economy is on life support? This trend line does not seem to bother our government, so they show revenues from natural resources in 2014 at $3.01 billion and in next year at $3.165 billion. Given the trend of the past 8 years, this revenue amount would more likely be $2 billion, which in turn means the government is expecting to collect $1 billion more than it will likely get.
Population growth cooling off
Since this is an examination of a moving target it is also instructive to look at other trends. The population values for the province give an indication of how many there are of us to pay the bills and use the infrastructure investments made by the government. Prior to the new century, the population of BC was increasing by 20% each decade. Since 2000, the rate of increase has fallen off to 12% per decade with further decreases expected into the future. This is hardly a representation of a growing need for the level of borrowing and spending carried out in recent years nor for the rest of this decade.
Lacklustre employment figures
The record of those employed in BC is also hardly inspiring. As of August of 2006, there were 2.147 million people employed in the province. By 2012, in the same month, there were 2.348 million. That was a 9% increase over that period, in line with a population increase of 10%, but not in line with the growth in nominal GDP of 25% for the same period. This suggests that the population of BC did not fully participate in the growth of the general economy but were left with all of the liabilities.
This condition is partially authenticated by an examination of electricity consumption, as reported by BC Hydro. All three categories of customers, residential, commercial/light industrial and heavy industrial, saw no change in total amounts consumed over the same period.
BC’s economic benefits flowing outside of province
From this record, it looks like the fiscal policies of the government have resulted in transferring a large proportion of the financial benefits from the economic growth of the past 8 years to folks other than those living in the province. The 2014 budget indicates no remediation of this condition.
Big spending continues, despite rising borrowing costs
If all of the above were not enough, the fiscal risk that comes with being a large borrower and spender is that of higher interest rates to come. Presented on page 81 of the budget is a “forecast “ of interest rates by the Bank of Canada, US Federal Reserve and the BC Ministry of Finance. It is clear that those folks all agree that borrowing costs are likely to increase, yet in the face of this expectation the government is proposing new capital spending including, but not limited to, $8-10 billion for the Site C electricity generation dam. These projects, on top of the legacy of previous investments, will do much to squeeze the budgets for health care and education making BC ever more unaffordable to live in.
It is clear that the 2014 budget makes no provisions to remediate the excesses of the past 8 years that are adversely weighing on the province’s population in the form of increasing ferry rates, increasing electricity rates, increasing car insurance rates, increasing property taxes and increasing health care costs. Just like all addicted gamblers, the government shows every intention of using the province’s credit card to fund speculative investment initiatives as its way of making things right.
It is looking to make a “Hail Mary Pass” – and the only thing it has to offer is its LNG pipe dream, which is more about selling hot air than natural gas.
Hello JVDV; Is there a quotable public information source that has population projections that give values that are different from those given by BC Statistics?
wow! what a great summation of the current government’s shortsightedness and blissful ignorance of the truth, put in a way that anyone (other than our current government) can easily understand. Really puts our predicament in perspective. Keep up the good reporting!
Govt says they will have budget surpluses, but the BC debt keeps growing.
LNG initial royalty rate plan is 1.5%, while companies pay capital costs, but they can deduct that from the later higher royalty rate.
So the royalty paid to BC is actually $0.00 during that time.
How will that pay down the huge and rapidly growing BC debt, as they claim it will?
And again, Andrew Weaver of the Green Party votes in support of BC Liberal budget. I guess he likes ferry fare increases, increase in fees for MSP, Hydro and ICBC. Continued carbon tax freeze on corporate oil and gas emitters and cuts to post-secondary education and training.
My question to Andrew Weaver is when will you be crossing the floor?
Eric Andersen: Re: BC’s population projection data — Do not trust it.
I know the BC Population numbers are most likely very bullish but they are taken from the official source, BC Statistics. As these are the numbers factored into the BCHydro annual electricity forecast it leaves me with little choice.
My guess is that the annual % change for the decade we are in is about +5%. Because unaffordability is becoming such a large issue for BC citizens you might have a guess when the province’s population goes negative.
Well shake it all down and what do we see? The current government which promotes itself as the party best able to conduct the big B. business of the province has sold off so many assets there is precious little left. If they are the best the people can buy we are screwed.