Editor’s Note: The Common Sense Canadian presents a second in-depth report from economist Erik Andersen on the troubling trajectory of BC Hydro’s finances. After first exposing Hydro’s increasingly shaky financial position in these pages last year, Mr. Andersen now delves into the numbers to show the inevitable consequences of this situation for the province’s ratepayers: skyrocketing power bills for years to come. On the bright side, we are making real headway in terms of domestic energy conservation – and yet, Hydro continues to commit us to more private power contracts we simply don’t need.
—————————————————————————
January news releases by BC Hydro indicated the intention to alter the “Standing Offer Program” (SOP) by giving new Independent Power Producers (IPPs) higher contract purchase prices for the electricity they generate. “The SOP pricing has been increased between 14 and 29%, depending upon the location of the project.” The SOP is a special private power purchasing program – separate from the “clean power call” tendering process – for “smaller” projects, which are entirely exempted from any public review process or environmental assessment. In addition to raising the purchase price for this power, BC Hydro intends to up the maximum size from 10 to 15 Megawatts.
What follows is a presentation about declining productivity at BC Hydro and why it is folly to be promoting more generation capacity in the circumstances of 2011.
It is instructive to look at the BC Hydro record when making a judgment as to their intention to contract for more IPP generation capacity. BC Hydro presented a ten-year outlook “for new resources” in their 2000 Annual Report. By 2009 the “probable forecast” of demand was to be 65,000 GW hrs. It was not made clear if this included demand from other than BC customers but it should not have as the corporation is only directed to serve the interests of BC customers (“domestic” customers in their language).
The actual energy sale to domestic customers in 2009 was 53,588 GW hrs – and by 2010 it had fallen to just 50,233 GW hrs.
This exaggerated outlook at future demand was in error by 21% (and 29% by 2010). From 2000, when the outlook was presented, there were 9 years of records that should have prompted a major revision of this inflated projection.
What would have been a better way to look at “planning for the future”?
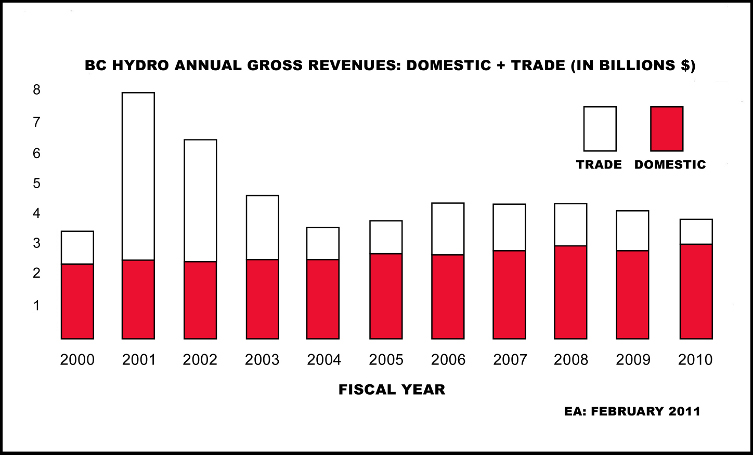
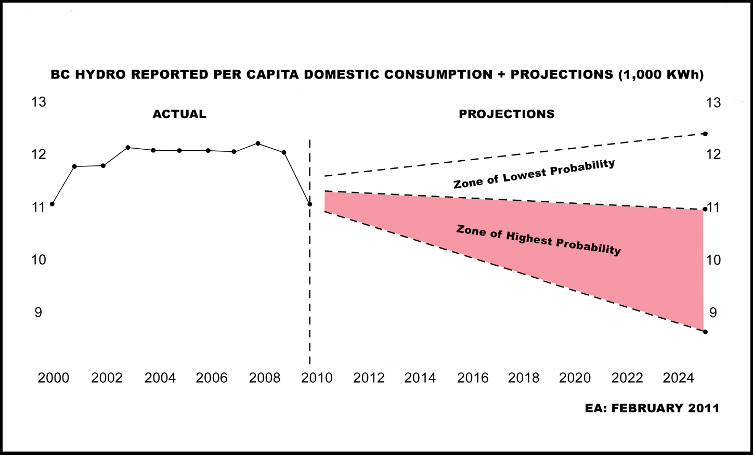
Graphic 1 below shows the annual domestic and trade (export) revenues from each of the past 11 years. Only minor changes in total domestic revenues have occurred. A slight increase in later years is explainable, not by volume of sales increases, but rather by rate increases. By comparison, revenues from sales to others have been very volatile and sharply lower in the most recent years. This record is indicative of a fickle market and one that should be avoided, not one to chase after. Planning for the future is therefore relatively straightforward. The strongest positive correlation is between the province’s population and per capita demand.

Graphic 2 is a demonstration of this relationship. It is divided to indicate the record up to 2010 and a projection to 2025. Because there has been a recorded drop-off in per capita electricity consumption in the past 2 years, it is reasonable to think of this continuing. Per capita consumption will decrease as citizens are forced to make accommodation in their budgets for higher food prices, taxes such as the HST, etc. There will also be substitution in response to higher rates, as is now occurring. Lastly, more people will try to lower consumption using an array of conservation methods such as more insulation, etc.

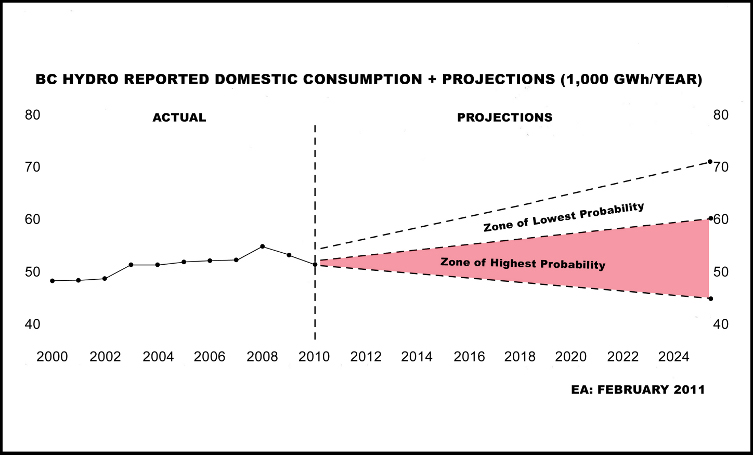
Graphic 3 is an extrapolation of the per capita consumption rates combined with the official projection for provincial population numbers, expressed in gross electricity demand for the province. As this graphic illustrates, the zone of highest probability indicates
that by 2025 the domestic demand would range between 45,000 and 60,000
GW hrs.

For the reader to appreciate the preceding outlook, it is instructional to look at BC Hydro’s financial record. With most businesses it is usual to expect increasing capital investment will produce improved productivity. The exact opposite has occurred at BC Hydro.
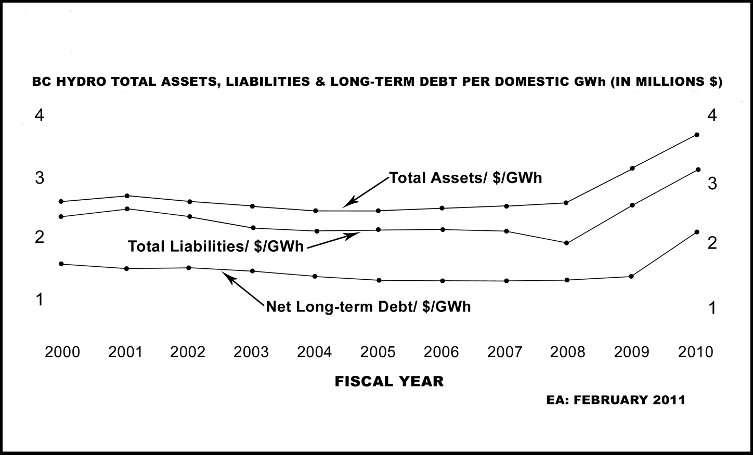
Graphic 4 below is an expression of asset and debt amounts, per GW hr of domestic production and sales, in each of the 11 years. At a glance it is easy to see that for a unit of energy, the needed financial resources remained remarkably constant until 2008 when we see the “Hockey stick” curve develop. In a few short years it suddenly took about 40% more financial resources to produce the same or less GW hrs of energy needed by domestic consumers.

So what does this record indicate?
BC Hydro is using vastly more financial resources to produce and deliver the amount of energy the domestic customers will need into the foreseeable future. This divergence in cost versus demand can only be managed by much higher electricity rates to its captive customers. Seeking greater returns from other than domestic customers is akin to pushing on a rope.
Promulgating a call for more IPP generated energy, at even higher than previous prices, suggests a situational awareness deficit at BC Hydro and is an insult to its customers.
Erik Andersen, Economist
February 13, 2011


