


It’s near inconceivable a 10,000-tonne train more than a kilometre long carrying 79 cars could start moving on its own steam up a hill. But that’s what a train did one month ago, according to official record. The ill-fated journey ended 12 kilometres down the track with an inferno in a place called Lac-Mégantic killing 47 people.
To date, the official narrative of the Lac-Mégantic disaster says it was because of insufficient braking the train rolled down a hill. But this topographic map of the area shows there’s no steep hill to speak of in the area. The train route (shown on the map as a black dotted line) was constructed to accommodate the lay of the land. Because of this, the train route meanders through the lowest, most level elevations.
This infographic produced by academics commissioned by the National Post is the most detailed depiction of the events published so far. The topography map, coupled with this infographic, prompts a deeper exploration of the train route via Google Earth, as the National Post infographic is simply an illustration of events instead of a fact-based depiction using actual data. Precise graphs for the entire route are retrievable through tools available on Google Earth.
According to Google Earth (a tool used by professionals the world over) the terrain at Nantes, Quebec, where the train was tied down for the night does not have any steep decline that might cause a runaway train. In fact, quite the opposite is true. As we will see, and the grade at the start is sloped toward Nantes, not Lac-Mégantic.
If the doomed train was staged at Nantes and rolled up hill toward Lac-Mégantic, it would have encountered another considerable uphill grade before the forces of gravity would enable the fate-filled journey as for the official runaway narrative. If the train was tied down in Nantes properly as reports indicate, it would have rolled away from Lac-Mégantic. The National Post infographic, however, has the train placed just outside of Nantes and closer to Lac-Mégantic. Even so, the train would still need to roll uphill in order to move toward Lac-Mégantic.
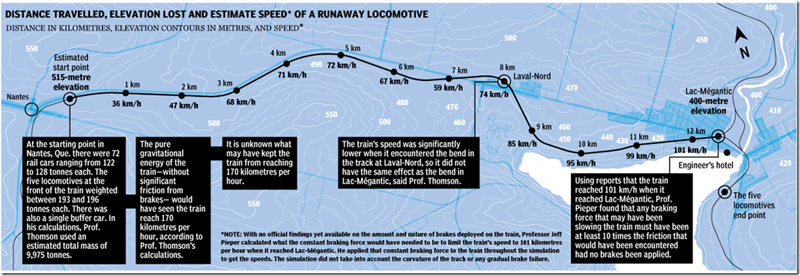
On top of this, seven kilometres after the uphill climb at Laval-Nord there exists a sharp curve at the foot of a long steady decline. If the train was a runaway at the speeds reported, this curve in the train track was impossible to negotiate without derailing. In fact, the curve at Laval-Nord is a much sharper curve than where the actual derailment occurred in Lac-Mégantic.
These anomalies which counter the official runaway narrative exist only after we overlook a number of other outstanding circumstances before the train even starts rolling. Perhaps the most mystifying of these outstanding circumstances is the combined failure of the hand and air brake systems. Another of these circumstances surround the black boxes, which were retrieved intact, yet still have not been decoded.
It took more than four days for the mainstream media to report that the locomotives were found unscathed approximately one-half kilometre further up the track, where one of the two black boxes was retrieved intact the day following the tragedy. Montreal, Maine, and Atlantic Railway Inc. owner Ed Burkhardt claims representatives from his company were allowed to inspect the locomotives. He said the locomotives had their brakes set, as the engineer claimed, and that their wheels sustained significant damage as a result.
These details were not reported by the Quebec Transportation Safety Board although they did report the locomotives were found up-track unscathed and that black boxes were retrieved. One of the many questions that arise as a result is, how did the engines uncouple from the train travelling at speeds preliminary black box data indicate were as high as 101 kilometres an hour, and then after rolling 13 kilometres, come to a stop a mere 500 or so metres away from ground zero?
There are also questions in respect to the volatility of the crude carried, and how on earth it resulted in such destructive explosions which lit up Lac-Mégantic as bright as neighbouring cities seen from space. As recently as August 1 Transportation Safety Board head Ed Belkaloul was quoted saying, “We’ve heard from a number of experts who confirm that the crude oil acted in a way that was abnormal.”
Many reports, including this one from National Geographic, have stated that four tankers involved in the disaster were “pressurized.” Numerous other reports make the same claims, however, none of the publications are from within Canada despite the fact all out-of-country reports claim the CBC as the source of the report.
There also continues to be unconfirmed claims that four cars with pressurized propane in them were on the siding rail in Lac-Mégantic. Subsequent reports by CBC suggest that propane storage facilities in the area of the derailment were responsible for the huge explosions.
In recent days, however, officials reported they have sent materials recovered from the tank cars to test the constituents in order to derive what may have been in the them. Paper work exists, as is required, outlining the constituents of the crude oil contents originating from the Bakken fields. Crude oil is not normally pressurized when transported, therefore, it remains unclear what some of the cars may have contained to prompt such devastating explosions that destroyed almost 40 buildings while bursting fiery mushroom clouds hundreds of metres into the sky.
Analysis
Days after the tragedy, the editor of a local paper described it as a mini 9-11, and the Prime Minister proclaimed the site looked like a war zone. At about this time, the National Post commissioned a number of academics from universities around the country to establish the infographic upholding the already well established runaway narrative. As the single most detailed account of the disaster to date, the National Post continues to use the infographic.
Let’s focus on what the academics commissioned by the National Post depict as the course of events on that day according to the official runaway narrative, resulting from the Transportation Safety Board’s investigation.
This is the depiction of the steep grade the runaway train travelled, according to the infographic. Note that the National Post graph depicts a steady uninterrupted decline from Nantes to Lac-Mégantic, and a quick jump in speed at the onset (0-36 kms/hr), with a steady increasing speed only interrupted at one point where there’s a decrease in momentum and speed (13 kms/hr between the 4-7 km mark.)
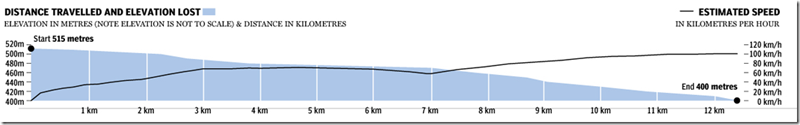
The infographic includes the caveat that the “elevation is not to scale,” and we are about to learn why.
This next detailed graphic depiction, with topographic overlay, gives further information supporting the narrative of a steep grade steadily declining from point A to B, including the jump in speed at the onset, and the slowing at Laval-Nord, while also depicting the twists and turns between Nantes and Lac-Mégantic. Note the text boxes containing the description of events are written by the academic authors of the infographic (if you are unable to read the text in this graphic, view the original).
Next, let’s focus on the National Post map’s Estimated Start Point. The black circle (see the graphic below) is probably where the rear of the train was when tied down for the night. Note how the graph depicts an uninterrupted decline and that the train was estimated to be travelling 36 kms/hr at the 1 kilometre mark. The train, however, is 1.4 kilometres long — a point overlooked.
It’s inconceivable the train, which requires tremendous force to get rolling would have gained the speed depicted in the infographic so fast, moreover, the National Post published a report where the Transportation Safety Board stated “insufficient braking was applied,” which means some hand brakes were indeed applied (the engineer claims up to 11).
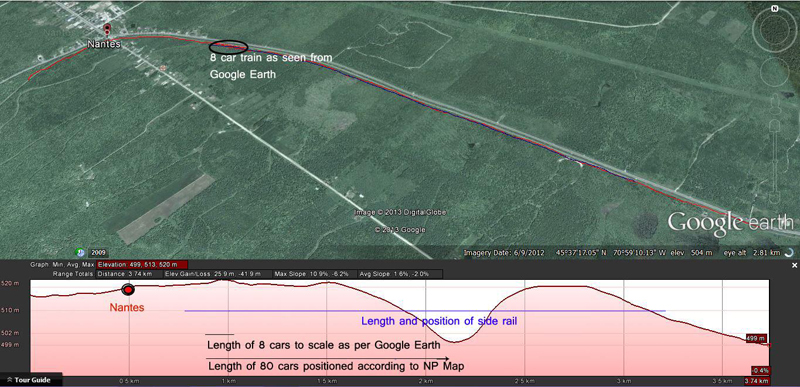
The train was tied down for the night on the main rail as another train occupied the siding. The purple line above depicts the precise position and length of the side rail as confirmed by different National Post infographic. The bottom most black line in the graphic above denotes precisely the position of the train according to both the National Post infographics, with the front of the train precisely at the bottom of the bowl grade where the black arrow is located. This means, according to the official runaway narrative, the train had rolled uphill from a standstill.
Included above is a reference to eight train cars (black circle) actually found in the Google Earth image. This was included for scale and the black line with arrow depicts the accurate length and placement of the train, as well as direction of travel. Note that even if the National Post infographic is wrong in its placement of the train (same place as depicted in the graph of the Google earth image), and the positioning of the train is shifted to any point along the side rail, it would still necessitate rolling up the steep incline — which equates to 20-plus metres over less than a 300 metre distance — from a standstill. This is known as a bowl track, and is used in the industry to ensure forces of gravity do not result in a runaway train.
When you consider this drastic upward grade, it is impossible to comprehend how the National Post infographic depicts the train moving from a standstill at all, let alone immediately reaching speeds of 36 kms/hr in the first kilometre. It simply defies the laws of physics for the train to roll uphill from a standstill.
Also, the train’s brakes were applied. This was confirmed by the Transportation Safety Board, therefore, it’s difficult to imagine how the train managed to start rolling under its own power with the brakes on uphill as is depicted in the graphic above.
Now let’s look at Laval-Nord, where the sharpest bend occurs. The infographic map depicts the train slowed down between the 4 kilometre and the 7 kilometre mark. According to Google Earth, however, this is where the steepest, straightest, and most steady decline of the entire journey exists.
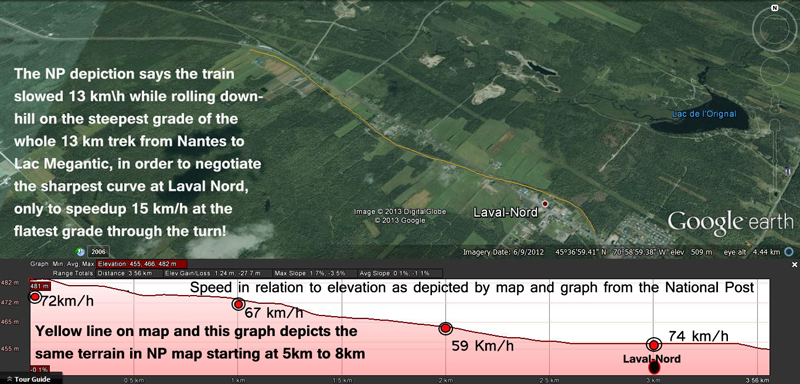
The speed indicated on the graph’s red line declines from 72 kms/hr to 67 kms/hr, and finally to 59 kms/hr, and are positioned precisely, as the infographic depicts, at the 5, 6 and 7 kilometre marks.
It’s self-evident the train could not achieve this decline in momentum while travelling fully 20 metres downhill along a less than 3 kilometre stretch, however, given that the sharpest bend of the journey occurs at Laval-Nord, the train would have had to slow in order to negotiate the sharp curve and not derail.
If the train was indeed a free rolling runaway train, this bend occurs at the bottom of a steady declining grade 8 kilometres from the starting point, therefore, the speed would have peaked at this point and derailment would have likely occurred in Laval Nord, not Lac-Mégantic.
Two days after the tragic incident, reports surfaced that the black boxes were successfully retrieved, and Transportation Safety Board official Ed Belkaloul was quoted saying, “We have examined the locomotive, we have verified all the mechanisms on it, we recovered a copy of the famous black box.”
Oddly, two weeks later, at the same time the Transportation Safety Board released its two safety recommendations based on insufficient braking being applied, which CBC TV described as “pinpointing the cause of the disaster,” the Transporation Safety Board also included on their website this language:
Start decoding the content of the locomotive event recorder as well as the sense and braking unit (commonly known as the black boxes).
This despite comments by the lead investigators hours after the incident, and media reports, stating that the preliminary data from the locomotive’s black box indicate the train was travelling at 101 kms/hr, which the National Post infographic geared its speed and momentum calculations to reflect. This suggests the authors built the model to meet the preliminary data retrieved from the black box.
This of course gives rise to a number of questions. Why are they twisting the data to support the narrative? Why is there a discrepancy in how this is being reported?
First, we immediately had one preliminary data point released, then 10 days later the Transportation Safety Board is still just starting to decode the data while at the same time the CBC reports they have pinpointed the cause which resulted in the issuance of the two safety recommendations.
The Transportation Safety Board website report goes on to say in somewhat cryptic fashion:
We have the information from the locomotive event recorder and the sense and braking unit from the back of the train. We know in what position the controls were found following the accident.
As of August 1, the Transportation Safety Board has completed onsite work but continues to state, “Data from the locomotive event recorder — also known as a black box — will also be reviewed to validate speed and air brake reaction.” This suggest that four weeks after the tragedy, the review has not been completed and possibly not even started. This stands in stark contrast to the recent disaster in Spain where many black box details were promptly retrieved, decoded and reported.
It seems that any credible investigation would immediately retrieve (which they did) the black boxes and then decode the data (which they have not). Why the delay? Why were the black boxes sent to the United States then returned before the information was decoded and reported? Why is a narrative being established and the cause pinpointed when the data contained in the black boxes (one specifically for braking) has yet to be completely retrieved, decoded and reported on?
It would seem that the academics who constructed the National Post infographic did so in such a way as to have the data support the one single piece of preliminary data released from the black boxes (that the train reached a speed of 101kms/hr). This was done despite the overt errors presented above in order to explain how this tragedy occurred and why the train derailed with such intense fury.
It’s difficult to ascertain the details of the Transportation Safety Board’s proclamation that insufficient braking was applied because according to all reports, they are providing no further details. Once again, it’s not understood why they simply do not decode and disseminate the information contained in the sense and braking unit that was recovered intact after the tragic incident.
Last week when the Transportation Safety Board made the announcement, accompanied with the two safety recommendations, they declared that everyone was going to take a break for the first time since the incident, which calls into question the priorities as it relates to the handling of the black boxes. Many will recall that at the same time as the Lac-Mégantic disaster a plane crashed on the west coast in the United States, the black boxes were retrieved as the first order of business and the details reported within days.
Even without these details, however, there remains the fact that most modern locomotives similar to the ones involved in Lac-Mégantic have the Westinghouse Braking System, which is claimed as a fail safe:
“Under the Westinghouse system . . . brakes are applied by reducing train line pressure and released by increasing train line pressure. The Westinghouse system is thus fail safe — any failure in the train line, including a separation of the train, will cause a loss of train line pressure, causing the brakes to be applied and bringing the train to a stop, thus preventing a runaway train.”
Then there is the hand-brake system, which even if it was insufficient as declared by the Transportation Safety Board, the engineer is reported as saying he set no fewer than 11 car-specific hand brakes, as well as all five locomotives as confirmed by company representatives who were allowed to examine the locomotives. Presumably all of these details are in the sense and braking unit. As of August 1, the Transportation Safety Board reports it’s moving to a lab to “test conditions that resulted in the train moving.”
Summary of the graphical information
What the Google Earth graphics reveal and confirm:
- The location of the tied down train includes an immediate and steep incline of 20 metres over less than 300 metres in distance — an impossible grade to travel from a standstill — no matter where the train was located along the side rail and regardless of the sufficiency of the applied braking system.
- The decline in grade approaching Laval-Nord where the sharpest bend of the journey exists, dictates that the runaway train would have gained tremendous momentum and reached peak speeds, making that sharp bend the place where derailment would most likely occur.
What errors and oversight are contained in the National Post infographic:
- The National Post infographic omits the immediate incline at Nantes, and instead depicts the quickest acceleration of speed over a single kilometre than anywhere else on the journey (0-36 kms/hr), despite the fact braking was indeed applied and the first bit of travel involved a short, steep incline.
- The National Post infographic depicts the complete opposite of reality by showing the train slowing down over the longest, steepest and steadiest decline of the entire trek in order to negotiate the sharpest bend of the journey, meanwhile the actual topography of the land dictates precisely the opposite would occur resulting in what would have been peak speeds, making Laval-Nord the most likely location of derailment for a runaway train on this track over this terrain.
What the Google Earth data dictates:
- According to the precise topography, in order for the train to begin rolling toward Lac-Mégantic from the staging ground in Nantes, power would have been required to start the train moving and pull it up the immediate inclining grade.
- Braking would have been applied in order for the train to slow enough before Laval-Nord, as depicted in the infographic, to avoid derailing at the sharp bend prevalent at the bottom of the long decline, 8 kilometres into the journey from Nantes. The industry standard to avoid derailment for such curves in the track is to not exceed 80 kms/hr. This also explains the National Post depiction not exceeding 80 kms/hr at this point, yet inexplicably reaching the 101 kms/hr mark over the last few kilometres as dictated by the one data point released from the black boxes.
Interesting article. Your claims about the grade are contradicted by the Transportation Safety Board’s final report (http://tsb.gc.ca/eng/rapports-reports/rail/2013/r13d0054/r13d0054.pdf), which shows a steady downward grade and states that the sharpest turn (the maximum horizontal curvature of the track) was found “at the derailment site” – though pictures (e.g. Figure 3) show that the track leading up to the derailment area was straight, and the train seems to have derailed before it had a chance to get to any tight turns. Note the somewhat confusing nature of Photo 1, which shows the curvature of the track, not leading up to the derailment site, but following it, as can be seen from the position of the lake at the right of the photo (cf. Fig. 3). Photo 29 on p. 106 shows that the curvature at the derailment site was negligable – I’m confident that I’ve driven safely at 110 km/h on Alberta highways with at least that much curvature. From photo 29, it looks as though the engines decoupled and went past the turnout, then the points were changed so that the tank cars veered off on the other track and derailed. What do you think?